Classifying BIP324 Traffic in a Full Network Capture: Preliminary ML Results
BIP324 encrypts P2P messages, while sizes, timing and direction remain visible. Building on my earlier passive analysis, I test whether one multiclass model can identify v2 activity in a full-network PCAP, using those measurements. I compare the two current models trained on the expanded dataset: Model 1 (XGBoost) and Model 2 (temporal CNN).
Collection and labels
The Warnet lab runs Bitcoin Core beside HTTP, HTTPS, Tor, obfs4-shaped, BitTorrent and UDP traffic, with accelerated Bitcoin timing and heavy background noise. A bridge sniffer records the mixed network. This is a controlled simulation.
The ML pipeline extracts 250 ms payload windows from supported TCP/UDP flows, without a Bitcoin-port filter or heuristic preclassification. Payload-free flows have no activity windows. Core connection records and message logs provide training/evaluation labels:
other: non-v2 traffic, including legacy v1 and background applications.handshake: the opening v2 connection exchange.inv: announcement of transaction/block identifiers.getdata: request for an announced object.tx: transaction transfer, including matchedinv→getdata→txsequences.block: full block transfer.cmpctblock: compact block transfer, reconstructed using transactions the receiver already has.bitcoin_v2_other: a v2 window without a matched specific event.
Ambiguous targets are excluded; a full block sharing a window with its request remains block. Matching uses endpoints and time, rather than decrypted packet-level truth. Older and newer prepared data use different pipeline revisions, which remains a limitation of this experiment.
What the models see
The feature builder supplies 34 numeric inputs:
- Current window (7): directional payload bytes/packet counts, totals and byte-direction imbalance.
- Burst timing (6): duration, byte rate and preceding gap, per direction.
- Neighboring windows (8): bytes 1, 2 and 4 observed windows before/after; bytes/packets in the preceding four.
- Connection age (4): elapsed seconds and phase flags for the first second, next four seconds and later traffic. The
handshakephase is a time range, not a Core label. - Opening exchange (5): first payload and initial sending-turn sizes per direction, plus entropy of early captured bytes.
- Whole flow (3): completed duration, total packets and payload-carrying packets.
- Transport (1): TCP versus UDP.
Excluded inputs:
- IPs, ports and IDs: identify flows and pair labels, but could memorize lab endpoints or known ports. Randomized-port validation remains separate work.
- Absolute time and node roles: could identify a particular lab run or node.
- Core logs, IP maps and noise-family labels: ground truth and error analysis only.
- Raw payload and heuristic detector flags: would introduce content signatures or reproduce an existing detector. Only the entropy summary is retained.
Model 1 — XGBoost classifies one feature row at a time. Model 2 — temporal CNN processes the target plus up to four adjacent buckets per side within the same flow, allowing it to learn short traffic sequences. Ambiguous windows may supply context. Future windows and whole-flow totals make both models offline classifiers.
Results: the two current models
Both models were fitted on the same training data and evaluated on the same combined held-out test set. The test includes previously used examples and newly reserved flows; all were excluded from fitting these models. The labels Model 1 and Model 2 identify the architectures, not successive dataset versions.
| Partition | Labeled windows | Flows | V2 flows |
|---|---|---|---|
| Training | 1,476,456 | 272,380 | 1,952 |
| Test | 170,830 | 31,993 | 250 |
That is 304,373 flows contributing labeled windows. Another 92,476 ambiguous windows were excluded as targets. A window is a 250 ms slice; a flow is the complete bidirectional exchange. Flow detection takes a majority vote across window predictions after mapping every v2 activity to Bitcoin.
| Metric | Model 1: XGBoost | Model 2: CNN |
|---|---|---|
| Window accuracy | 98.21% | 98.56% |
| Macro F1 (eight classes) | 0.736 | 0.780 |
| Balanced accuracy | 0.808 | 0.850 |
V2 windows predicted as other | 19 / 12,859 (0.1478%) | 16 / 12,859 (0.1244%) |
other windows predicted as v2 | 129 / 157,971 (0.0817%) | 56 / 157,971 (0.0354%) |
| V2 flows found (majority vote) | 250 / 250 | 249 / 250 |
| Non-v2 flows incorrectly called v2 | 3 / 31,743 | 5 / 31,743 |
other accounts for 92.5% of test windows, so per-class F1 helps interpret the overall accuracy:
| Activity | Test windows | Model 1 F1 | Model 2 F1 |
|---|---|---|---|
| V2 handshake | 203 | 0.892 | 0.895 |
inv | 6,609 | 0.881 | 0.913 |
cmpctblock | 1,000 | 0.807 | 0.777 |
tx | 249 | 0.672 | 0.688 |
block | 88 | 0.626 | 0.795 |
getdata | 347 | 0.399 | 0.453 |
| V2 without a matched specific activity | 4,363 | 0.611 | 0.718 |
Model 2 has higher macro F1 and fewer noise false positives per window. Model 1 finds all 250 v2 flows after voting, while Model 2 misses one. Their window-level and flow-level errors therefore describe different behavior.
The CNN's 56 false-positive windows were mainly Tor (25) and obfs4-shaped traffic (24). XGBoost's 129 were mostly HTTPS (47), obfs4-shaped (39) and HTTP (34). Only 88 full-block windows are scored, so block results still have limited support.
Which inputs matter?
Comparing both models with the same method
To compare their dependence on the inputs, I used grouped permutation on the same 1,820 sampled test windows. Each model stays fixed while related measurements are shuffled between examples. The CNN's group is shuffled jointly across its input context. Class-prevalence weights correct the scoring of the balanced sample.
The table shows the absolute macro F1 decrease (0–1 scale), averaged over three shuffles; ± is the standard deviation across those shuffles. A larger drop means the model was more sensitive to that group under this perturbation.
| Shuffled input group | Model 1: XGBoost | Model 2: CNN |
|---|---|---|
| Burst timing | 0.128 ± 0.004 | 0.407 ± 0.052 |
| Current-window sizes/counts | 0.239 ± 0.006 | 0.352 ± 0.031 |
| Neighboring-window features | 0.275 ± 0.010 | 0.146 ± 0.010 |
| Whole-flow statistics | 0.200 ± 0.022 | 0.173 ± 0.042 |
| Connection age | 0.103 ± 0.012 | 0.146 ± 0.015 |
| Opening exchange | 0.057 ± 0.034 | 0.169 ± 0.016 |
| TCP / UDP | 0.003 ± 0.001 | 0.069 ± 0.003 |
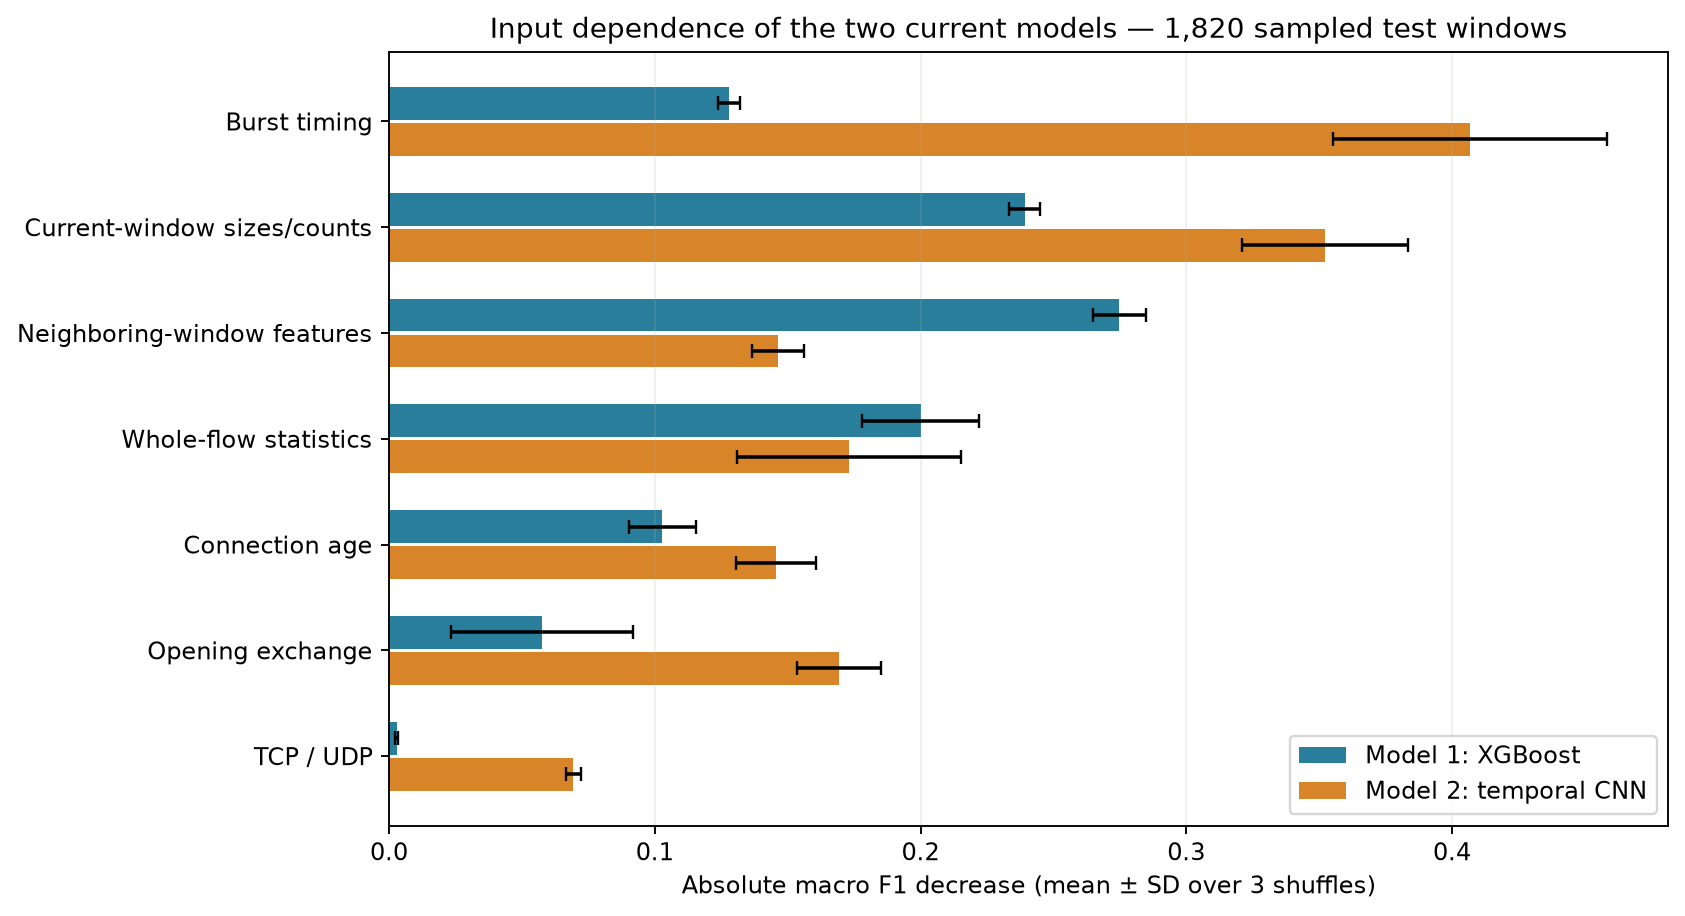
- Model 1 relies most on explicit window history/context: neighboring-window features cause a 0.275 F1 drop, followed by current-window sizes/counts (0.239) and whole-flow statistics (0.200).
- Model 2 relies most on burst timing and current sizes/counts: their mean drops are 0.407 and 0.352. Duration, rate and gaps in the bursts matter more to this model than to Model 1 (0.128 for the same timing group).
- Opening-exchange features also affect Model 2 more: 0.169 versus 0.057. Conversely, its explicit neighboring-window columns cause a smaller drop (0.146 versus 0.275). The CNN already receives neighboring windows as a sequence, which can substitute for some engineered lag/lead columns.
On this sample, unperturbed macro F1 was 0.746 for Model 1 and 0.807 for Model 2; these are sample estimates, separate from the full-test scores above. For example, the CNN's timing perturbation lowers its sampled F1 from about 0.807 to 0.400: an absolute decrease of 0.407.
Both models depend on complete-flow information, but the feature groups are not equally influential. Shuffling can create unrealistic combinations and correlated inputs can substitute for each other; these drops do not predict performance after feature removal, padding or another privacy intervention.
Additional detail for Model 1: SHAP
Exact TreeSHAP provides individual-feature attribution for Model 1, using 1,858 selected windows with population weighting. Its largest mean absolute contributions, averaged over output-class scores, were:
| Model 1 input | Mean absolute SHAP |
|---|---|
| Connection age | 0.650 |
| Current-window payload bytes | 0.648 |
| Complete-flow payload packet count | 0.597 |
| Packets in the previous four observed windows | 0.411 |
| Complete-flow duration | 0.390 |
See the Model 1 SHAP plot. Within true activities, handshake attribution emphasized prior packet counts, age and next-window bytes; inv/getdata emphasized byte volumes and nearby windows; tx emphasized gaps and byte history. Block attribution depended strongly on age and flow duration, suggesting a possible lab timing shortcut.
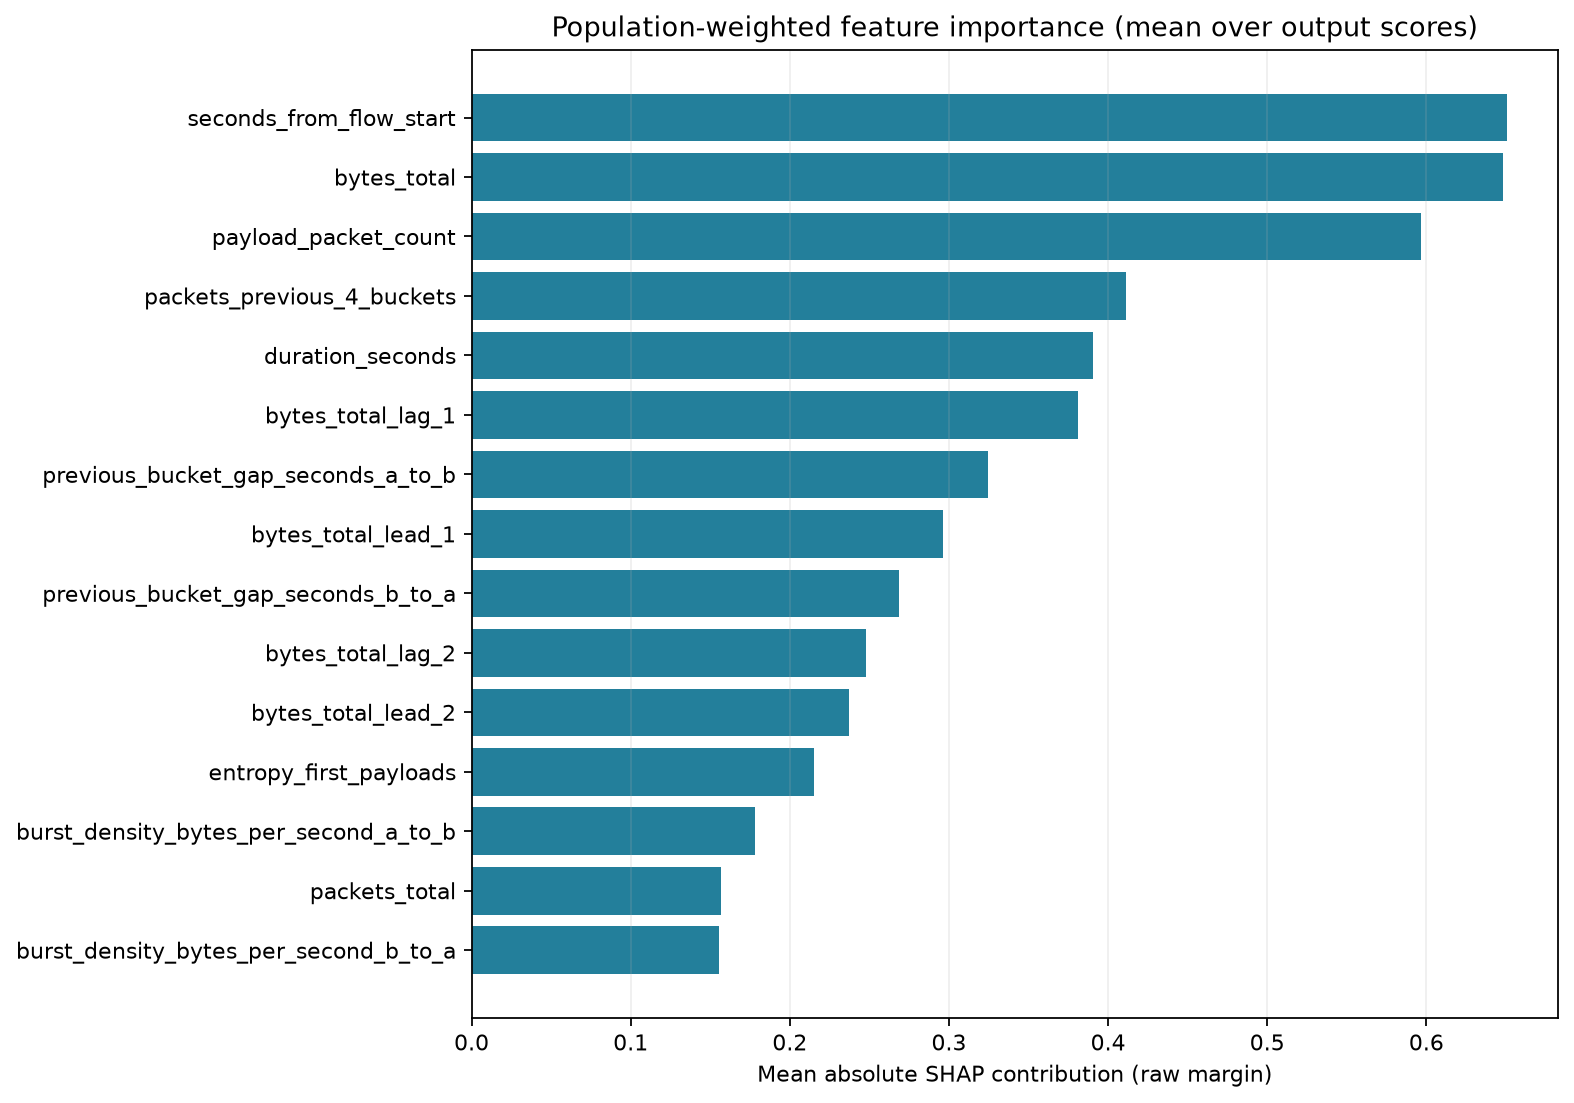
SHAP uses raw class-score units; permutation measures F1 drops. Their numbers cannot be compared directly. The CNN findings above are group-level permutation results; they do not establish which individual burst measurement dominates or provide CNN SHAP values.
Good handshake F1 here also uses later traffic and completed-flow information. It does not demonstrate identification from the opening packets alone. A causal feature set and grouped ablations are needed to assess what remains available to an online observer.
Model 2 used 32 GPU epochs and batches of 1,024. These remain exploratory lab results: some test examples have guided earlier comparisons, preparation differs between older and newer data, and topology, Core build and generators are shared. Untouched data, randomized ports and different traffic environments are still needed before claims about mainnet or an ISP.